Benchmarking ATAC-seq peak calling
ATAC-seq (Assay for Transposase-Accessible Chromatin using Sequencing) is becoming increasing popular as a method to investigate the accessibility of DNA in different biological states. Our lab has been using ATAC-seq for the last couple of years to see how Drosophila chromatin changes in response to alcohol exposure (Yes, we get flies drunk! It’s pretty interesting!). As our lab’s bioinformatician, I have developed an in-house pipeline for our analysis needs. The pipeline is based off suggestions from ENCODE, Harvard FAS Informatics, and other scientific bodies/individuals. While most scientists agree about the majority of the steps needed to analyze ATAC-seq data, there is a question mark about how to identify accessible regions, also known as ‘peaks’. Until very recently, the community simply tried to adapt tools originally intended for ChIP-seq data (MACS2, f-seq, ZINBA). This past year brought HMMRATAC, an ATAC-seq specific peak caller, as well as the unpublished Genrich, a new general peak-caller with an ATAC-seq option. The goal of this project is to benchmark the performance of common ATAC-seq peak-calling methods.
Peak Callers
Based on published papers and message boards, MACS2 seems to be the most popular tool to analyze ATAC-seq peaks. Though unpublished, Genrich appears to be gaining traction among users. HMMRATAC is also increasingly mentioned, often with caveats about run time. This section is dedicated to these three methods (as well as multiple MACS2 options).
MACS2
MACS2, or Model-based Analysis for ChIP-Seq, is the most well-known and -used tool for peak calling. As evidenced by its name, it was originally developed for ChIP-seq. It uses the Poisson distribution as the null basis for detecting genome biases and enrichment. A sliding window technique is employed to find more accessible regions. It was originally created by Tao Liu. One problem with MACS2 is that there is no consensus on how to use it with ATAC-seq. There are three commonly used options. First, the default is to use MACS2 in ‘BAM’ mode and extend each read fragment in both directions. This mode throws away half of properly paired data and has issues with false positive peaks due to fragments being shifted and extended. The second common method is to use ‘BAMPE’ mode. This method utilizes both reads of paired-end data and infers full fragments instead of cut sites. This method ignores any extension or read shift parameters. A third manner in which to use MACS2 for ATAC-seq is to use ‘BED’ mode. In this case, a paired-end BAM file is converted to a BED file, and then the extension and shift parameters can be used. It is, in a sense, the combination of the typical ‘BAM’ and ‘BAMPE’ methods.
Genrich
Genrich was recently developed by John Gaspar, previous of Harvard FAS Informatics. The default method is for ChIP-seq peak-calling but there is an ATAC-seq specific mode which can be enabled by the -j parameter. To account for the manner in which the Tn5 enzyme inserts itself into the genome, Genrich centers a 100 bp interval on the end of each correlating fragment. It uses the log-normal distribution to calculate p-values for each base of the genome.
Some advantages over MACS include how much faster it runs (It is written in C), as well as the capability of calling peaks for multiple replicates collectively. Unfortunately, Genrich is yet to be published, creating some hesitancy among researchers.
HMMRATAC
HMMRATAC is the only peak-caller designed specifically for ATAC-seq. It was developed by Eddie Tarbell and Tao Liu (of MACS2 fame). HMMRATAC uses a three-state Hidden Markov Model (HMM) to segment the genome into open chromatin regions, nucleosomal regions, and background regions. It employs a semi-supervised machine learning approach to train its HMM states. Though HMMRATAC has much potential as a peak-caller, it is quite computationally intensive. It requires a lot of memory and often takes hours to run. HMMRATAC also creates a gappedPeak file rather than narrowPeak files like the tools above. While not inherently wrong, it does not easily lend itself to traditional peak understanding or differential peak finding. The author’s recommendation of using HMMRATAC for differential peak finding is to extend the peak summits 50 base pairs in both directions.
Materials and Methods
Materials
The human GM12878 cell line ATAC-seq paired-end data used was publicly available and downloaded from three different datasets. The first three SRA accession numbers, SRR891269-SRR891271 (Buenrostro 2013), were used in the HMMRATAC paper while two SRA samples, SRR5427884-SRR5427885 (Corces 2017), were used by Gaspar in his preprint, Improving Peak-Calling with MACS2. Three replicates from the Parker lab’s recent publication, Quantification, Dynamic Visualization, and Validation of Bias in ATAC-Seq Data With Ataqv, were also used (GSM3738821,GSM3738828,GSM3738835). These datasets will be heretofor be referred to as Original, Omni, and Parker, respectively.
Preprocessing
I created a Nextflow script to automate all of the preprocessing steps. To summarize, fastq pairs are first evaluated with FastQC. TrimGalore is used to remove adapters and low quality reads from the fastq pairs. The reads are then aligned against the hg38 genome with Bowtie2 and sorted with Samtools. Picard is used to remove duplicates. Note that for Genrich, the bam file must be sorted by read names which is also accomplished with Samtools but with the parameter -n. Also, replicates were merged with Samtools and then preprocessed using the aforementioned steps. The Nextflow script is available on Github.
Peak Calling
Three methods of MACS2 were used, BAM, BAMPE, and BED. Peaks were called at the following p-values: 0.0001, 0.001, 0.01, 0.05, 0.1, 0.25, 0.5. Genrich peaks were also called at the same aformentioned p-values. Genrich was used both in replicate mode (BAM replicates not merged together) and in normal mode (BAM replicates merged together). HMMRATAC peak calling was done at score cutoffs of 0, 5, 10, 15, 20, 25, 30, 35, 40, and 45. Both gappedPeak and extended summits formats were used.
‘Gold Standard’ Lists
The ‘gold standard’ dataset was downloaded from the supplementary data from the HMMRATAC paper, which was originally downloaded from the UCSC genome browser track wgEncodeBroadHmmGm12878HMM. This dataset, called ‘active regions’, is made by merging two chromatin states ‘Active Promoters’ and ‘Strong Enhancers’ generated by chromHMM in GM12878 cells. The ‘real negative’ dataset was also downloaded from the supplementary data from the HMMRATAC paper. This set came from the ‘Heterochromatin’ state annotation from chromHMM. As both BED files were originally created with the hg19 genome, I used the UCSC LiftOver tool to convert the coordinates to hg38.
Find Peak Overlaps with ‘Gold Standard’
Peaks in each peak file were combined (so as not to double count any region in the peaks) with bedtools merge after the peak file was sorted. bedtools intersect -a GoldStandard -b peakFile -wo was used to find the overlap between the peak regions and the Gold Standards (both active and closed). The -wo option is used to print out the length (in number of bases) of each region’s overlap. awk is then used to tally up the total number of overlapping bases.
Calculations
Calculations were performed similarly to those in the HMMRATAC paper. Real positives (RP) were defined as the bases in the ‘Gold Standard’ active regions, and real negatives (RN) were defined as the bases in the ‘Gold Standard’ heterochromatin regions. True Positives (TP) are the bases which overlap between a called peak and real positives. False positives (FP) are bases which overlap between a called peak and the real negatives.
Precision (PPV) was found with TP/(TP + FP). Recall (TPR) was found with TP/RP. False positive rate (FPR) was found with FP/RN. F1 score was found with 2 * ((PPV * TPR)/(PPV + TPR)). These calculations were done with awk.
Find Coverage of Each Base in a Peak
bedtools coverage was used to find the coverage of each base of a peakset. Bases with a coverage <= 2 were labeled as false positives (bad). Bases with a coverage > 2 and <= 6 were labeled as ‘okay’. Bases with a coverage > 6 were labeled as good.
Data Analysis
PR (precision-recall) curves were generated in R. The function AUC from the library DescTools was used to calculate the area under the curve for each curve. Graphs were created in R using ggplot. Rscript can be found on Github.
Results
Precision-Recall
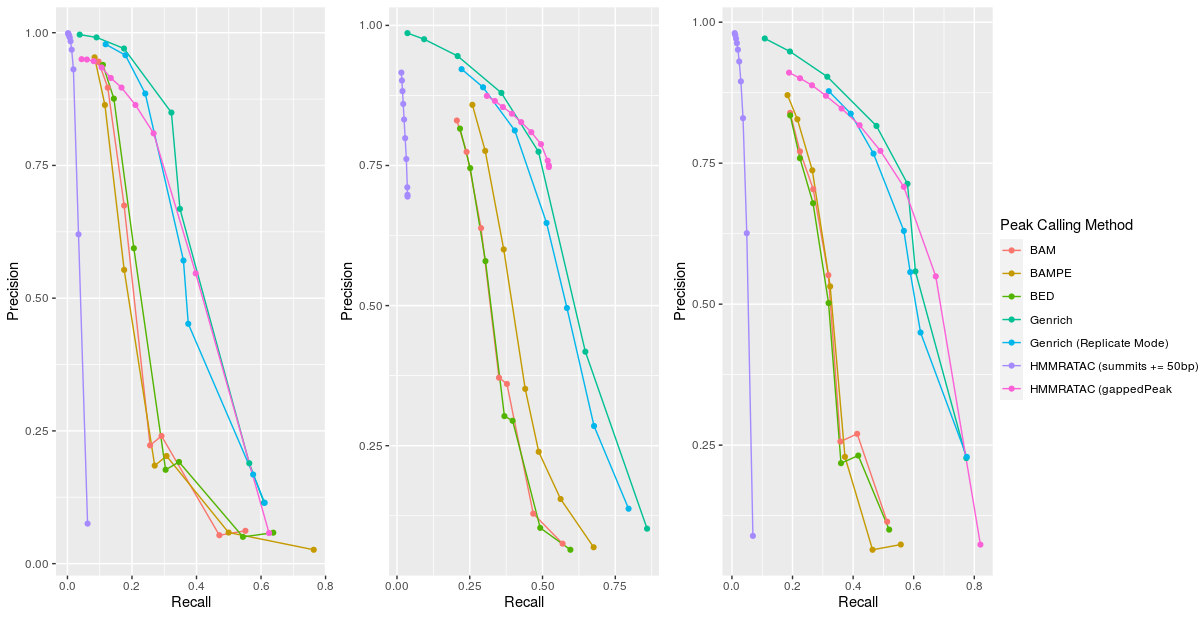
I sought to first compare the performance of the different peak calling methods by using precision and recall. One of the biggest issues in computational biology algorithm development is the lack of proper “gold standards.” I followed the lead of the HMMRATAC paper authors and used the ‘active regions’ dataset from the UCSC genome browser track wgEncodeBroadHmmGm12878HMM. These features are the ‘Active Promoters’ and ‘Strong Enhancers’ generated by chromHMM. A true negative dataset was created from the regions labeled as ‘Heterochromatin’ from the same chromHMM tool. To determine how the peak calling methods’ outputs compared against these ‘gold standards’, I used different significance cutoffs to evaluate sensitivity and specificity for these peaks. With bedtools intersect, I evaluated each base pair in its respective peak file to see if it was also present in the ‘gold standard.’ I found that Genrich outperformed all other methods in terms of precision, recall, F1 scores, FPR, and AUPRC. It is important to note that using Genrich in replicate mode actually performed slightly worse in these metrics compared to the standard Genrich method. The three different MACS2 methods performed similarly poorly, while HMMRATAC seemed to be more variable. The summits method of finding HMMRATAC methods found such few base pairs as to render the evaluation of precision and recall practically useless. Also, the HMMRATAC method was a bit fickle and didn’t always generate the expected results. Due to the length of its runtime, I did not adjust the manual settings as suggested by the tool’s author.
 |
|---|
| Figure 1: Precision-Recall Curves for each Peak Calling Method. Datasets are Omni, Original, and Parker, respectively |
| Omni | Original | Parker | |
|---|---|---|---|
| BAM | 0.141 | 0.135 | 0.139 |
| BAMPE | 0.150 | 0.156 | 0.142 |
| BED | 0.151 | 0.127 | 0.131 |
| Genrich | 0.388 | 0.560 | 0.494 |
| Genrich (Replicate Mode) | 0.277 | 0.341 | 0.274 |
| HMMRATAC (summits +- 50bp) | 0.038 | 0.017 | 0.042 |
| HMMRATAC (gappedPeak) | 0.357 | 0.176 | 0.426 |
Table 1: AUC for each peak calling method for each respective dataset
Coverage at Each Peak’s Base Pairs
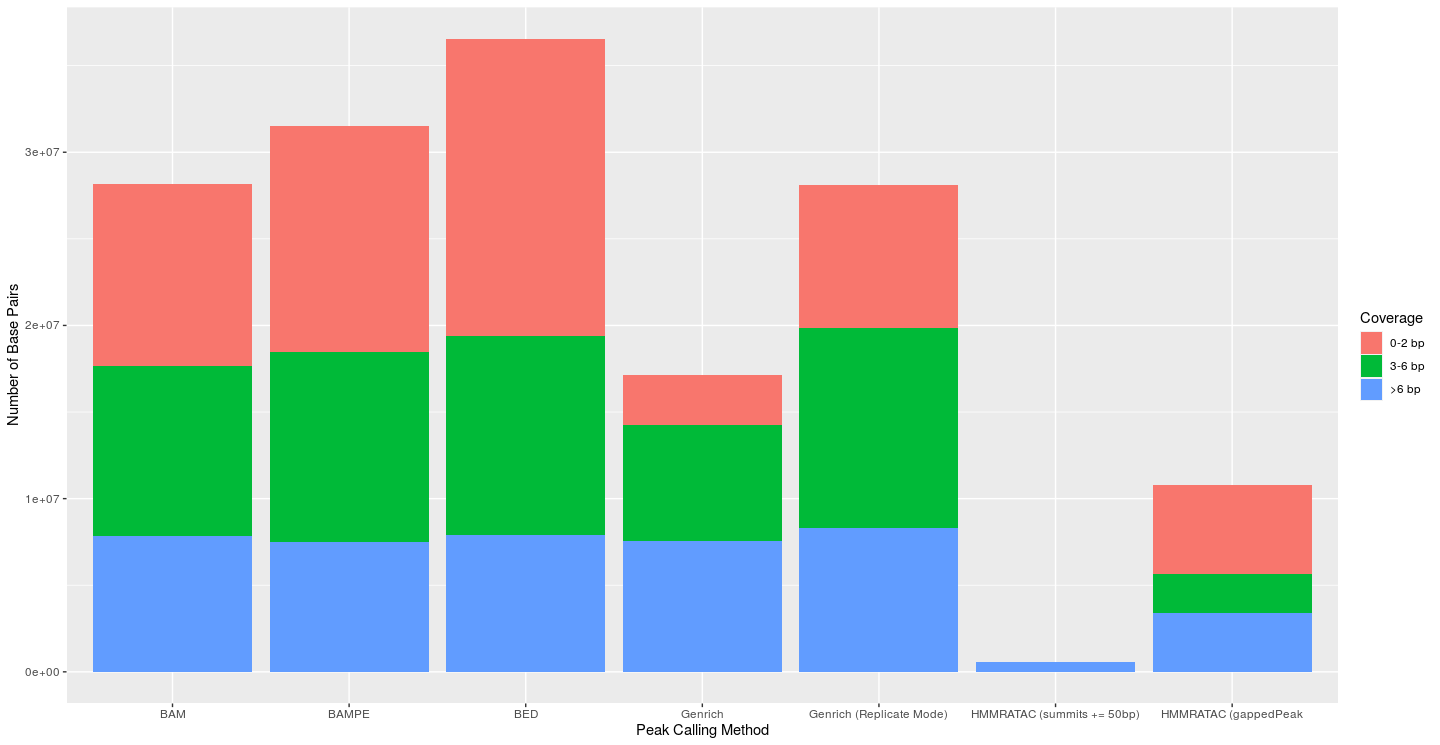
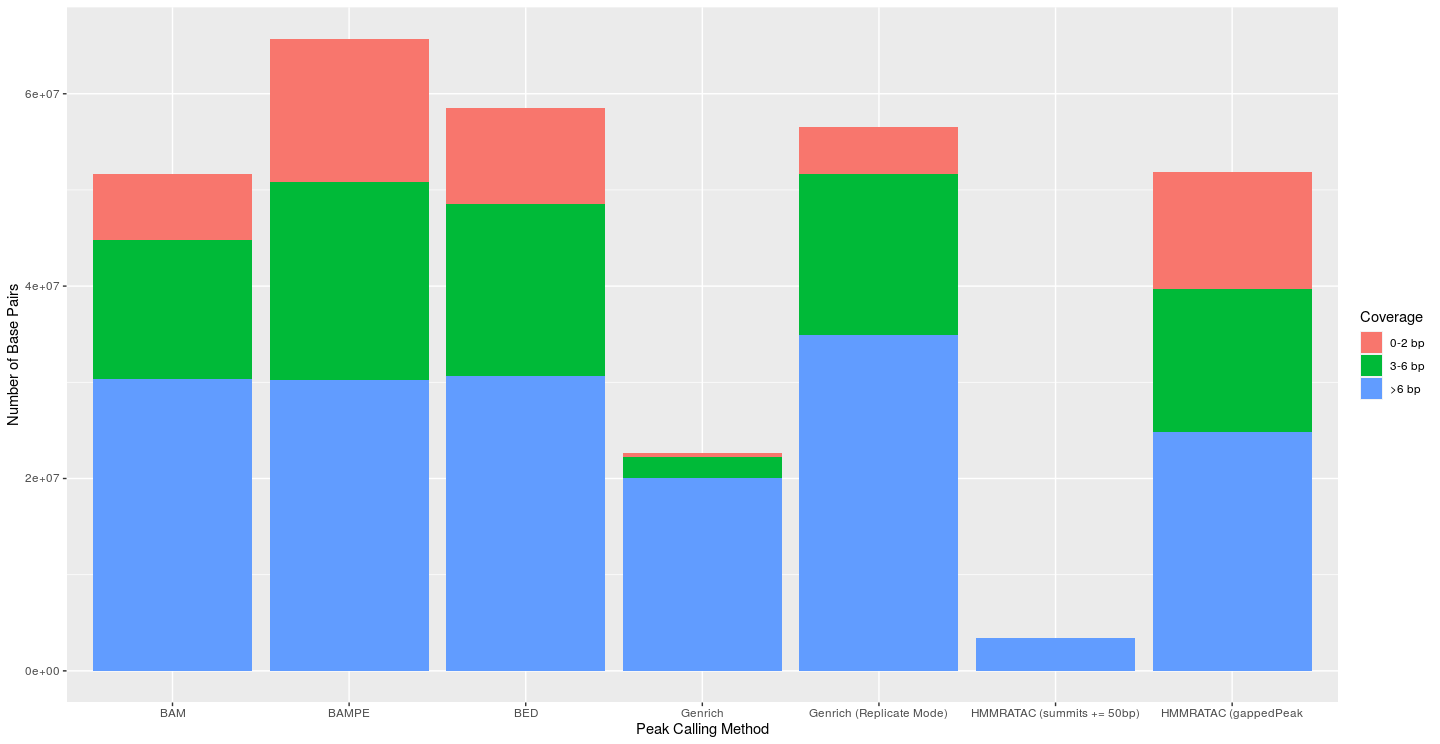
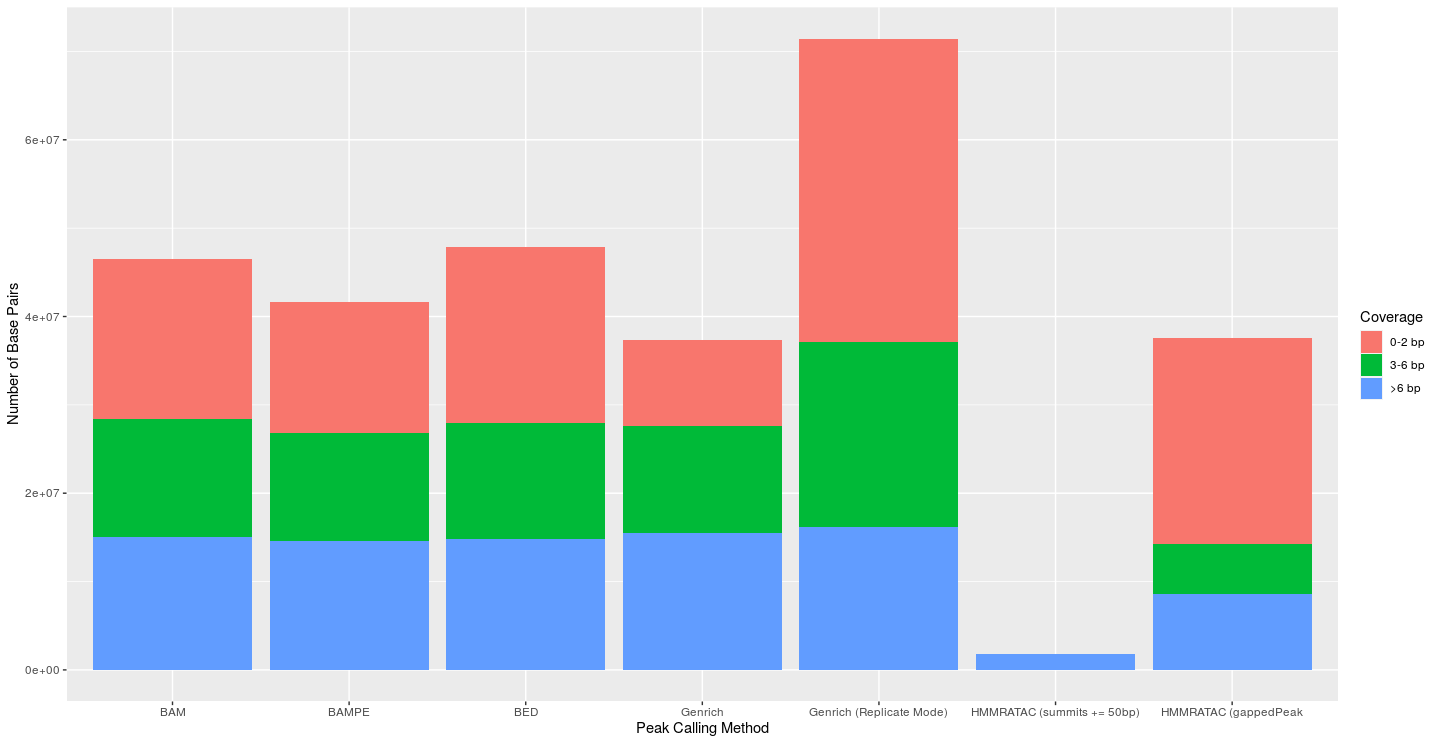
I next attempted to evaluate the coverage of each peak’s base pairs. I used bedtools coverage to find the coverage of each base in each called peak. Bases with less than 3 reads were viewed as false positives. Bases with greater than 6 reads were seen as true positives, and those in between were seen as just okay (This approach is similar to what Gaspar used in his preprint evaluating MACS). For MACS2 and Genrich, I used a p-value of 0.01 to create the graphs below, as that is the default p-value for Genrich. MACS2’s default threshold is a q-value of 0.05 (using the Benjamini-Hochberg procedure), thus, the default parameters of the MACS2 outputs would most likely lead to fewer peaks and bases than shown here. The default cutoff value for HMMRATAC is 30 and was thus used. At all levels of significance, the traditional Genrich approach had a much lower percentage of base pairs with less than 3 reads (false positives). Genrich in replicate mode consistently called more peaks and base pairs than normal Genrich mode, but this was usually accompanied by a large decrease in specificity. The HMMRATAC method (gappedPeak) performed poorly in this metric when compared to the others. And while the HMMRATAC method of extending the summits led to peaks which were almost only made of base pairs with coverage greater than 6, this came with a tremendous loss of sensitivity.
 |
|---|
| Figure 2: Coverage of each base of called peaks from the respective peak calling method (Omni Dataset); p-value for Genrich and MACS2 set at 0.01; cutoff for HMMRATAC was 30 |
 |
|---|
| Figure 3: Coverage of each base of called peaks from the respective peak calling method (Original Dataset); p-value for Genrich and MACS2 set at 0.01; cutoff for HMMRATAC was 30 |
 |
|---|
| Figure 4: Coverage of each base of called peaks from the respective peak calling method (Parker Dataset); p-value for Genrich and MACS2 set at 0.01; cutoff for HMMRATAC was 30 |
Discussion
I evaluated three tools and seven methods for peak calling for ATAC-seq data. To test each method’s performance, I found how each method’s called peaks compared against ‘gold standard’ positive and negative peaksets. I found that Genrich outperformed all other methods in terms of precision, recall, F1 scores, FPR, and AUPRC. I also checked the coverage of each base of each method’s peakset to see how specific the peak calling method was to the actual data. These results showed that Genrich did the best job of capturing bases with high coverage while minimizing bases with low coverage (< 3 reads). Based upon these results, I would currently recommend Genrich in traditional mode for those wishing to call peaks on ATAC-seq data. While this requires additional steps of sorting BAM files by name and merging replicates, it seems to perform best. It also runs faster than MACS2 and much, much faster than HMMRATAC. If one wished to increase sensitivity and didn’t care much to control for specificity, then it would seem reasonable to use Genrich in replicate mode and skip the merging of replicates. As an aside, I am very much interested in the development of HMMRATAC. It is still the only ATAC-seq specific peak caller and its developer is actively improving and updating it. This may be in contrast to Genrich, as the developer left his previous position and may not be focused on this tool as much. I am not sure. So for now, I recommend using Genrich and following along as HMMRATAC is actively developed.
References
ATAC-seq peak calling with MACS. https://www.biostars.org/p/209592/.
Babraham Bioinformatics - FastQC A Quality Control tool for High Throughput Sequence Data. https://www.bioinformatics.babraham.ac.uk/projects/fastqc/.
Babraham Bioinformatics - Trim Galore! https://www.bioinformatics.babraham.ac.uk/projects/trim_galore/.
Buenrostro, J. D., Giresi, P. G., Zaba, L. C., Chang, H. Y. & Greenleaf, W. J. Transposition of native chromatin for fast and sensitive epigenomic profiling of open chromatin, DNA-binding proteins and nucleosome position. Nature Methods 10, 1213–1218 (2013).
Corces, M. R. et al. An improved ATAC-seq protocol reduces background and enables interrogation of frozen tissues. Nat Methods 14, 959–962 (2017).
Feng, J., Liu, T., Qin, B., Zhang, Y. & Liu, X. S. Identifying ChIP-seq enrichment using MACS. Nat Protoc 7, (2012).
Gaspar, J. M. Improved peak-calling with MACS2. http://biorxiv.org/lookup/doi/10.1101/496521 (2018) doi:10.1101/496521.
Langmead, B. & Salzberg, S. L. Fast gapped-read alignment with Bowtie 2. Nature Methods 9, 357–359 (2012).
Li, H. et al. The Sequence Alignment/Map format and SAMtools. Bioinformatics 25, 2078–2079 (2009).
Orchard, P., Kyono, Y., Hensley, J., Kitzman, J. O. & Parker, S. C. J. Quantification, Dynamic Visualization, and Validation of Bias in ATAC-Seq Data with ataqv. Cell Syst 10, 298-306.e4 (2020).
Paired end peak callers. https://www.biostars.org/p/365243/.
Picard Tools - By Broad Institute. http://broadinstitute.github.io/picard/.
Quinlan, A. R. & Hall, I. M. BEDTools: a flexible suite of utilities for comparing genomic features. Bioinformatics 26, 841–842 (2010).
Tarbell, E. D. & Liu, T. HMMRATAC: a Hidden Markov ModeleR for ATAC-seq. Nucleic Acids Res 47, e91–e91 (2019).
Yan, F., Powell, D. R., Curtis, D. J. & Wong, N. C. From reads to insight: a hitchhiker’s guide to ATAC-seq data analysis. Genome Biology 21, 22 (2020).
Zhang, Y. et al. Model-based Analysis of ChIP-Seq (MACS). Genome Biology 9, R137 (2008).
