
To Pass or not to Pass? A Canadian Salad Dilemma
This past Labor Day weekend, my wife and I went camping at Lake George in upstate New York. This was our first time in New York (outside of Times Square) and we were amazed at how beautiful it was! The mountains were soft and inviting in contrast to the mammoth peaks we were used to in Utah. The water was incredibly clear, and it wasn’t nearly as cold as I thought it was. I’d give the nature in the area a solid 10/10.
We took this trip with some new friends we’ve made here in Hershey. We
were joined by some of their old friends from undergrad who happen to
live somewhat in the area. We had some delicious brats, visited a local
ice cream place, and even had time for a nice little hike. 
Canadian Salad
Our last night camping, we played a card game known as Canadian Salad. I had never heard of it, which isn’t necessarily a surprise since I haven’t played too many card games. The premise is to avoid winning certain cards or tricks. Low score wins. In a sample hand, the player to the left of the dealer will lay down the first card. The players must play a card of the same suit, if possible. If not, they can play any other card. Whoever played the highest card of the original suit wins the trick (takes the cards laid down) and will have points added against them depending on what the objective of that hand was. Apparently, there are all sorts of house rules, but seeing as I have played this game on exactly one occasion, this is all I really have to say about the game.
Towards the end of the game, one of our new found friends says that we should get to pass two cards to a different player at the beginning of each hand to even out the hands. Now did he mention this because he was losing badly and his wife was winning? Maybe. Maybe not. Apparently, this is done in Hearts, another card game I haven’t played. Either way, the rest of us weren’t really sold that passing cards would make the game more fair. Perhaps it’s because he’s doing an Applied Math PhD, and we just wanted to argue with him. Or it could be that we’re just bad at estimating things (We had previously tried to estimate what elevation we were at and some of us were MAGNITUDES off). We ended up indulging him in his card passing method the next game. This time he won, and his wife lost quite badly. So it did end up working in his favor at least one time.
While we were arguing about whether passing our bad cards would make the game more fair, I may have told our Applied Math friend to “prove it.” This led to a fun conversation the next morning about how we would model/simulate the problem. He sent us his modeling a couple days after this conversation (His code was in Julia and I’m sure much faster than my subsequent R code, but unfortunately I will probably have to wait until my PhD starts to really delve more into that language). What follows is my attempt to prove the method of passing unwanted cards to another player as a way of creating more fair hands.
Modeling
First, I load my handy-dandy tidyverse library.
library(tidyverse)
Now, I want to create a function that simulates the beginning of a game of Canadian Salad. I want it to take the number of players and number of cards to be passed as variables. I create a normal deck of 52 cards with 4 suits of 13 different cards. I deal the deck so each player gets an equal number of cards. If there are any cards leftover, then it gets put into the ‘kitty’ (I also saw caddy online and some people play this part differently).
The difficult part of modeling this idea of passing cards is what rationale players use to decide which cards to pass. Some people use a strategy of trying to get rid of a certain suit. Some try to just get rid of their highest cards so they are less likely to have the high card that wins a trick. Strategy can vary based on the objective of that hand, of course. So, overall, we decided it would be easiest to just model the strategy of passing the highest cards. Perhaps there is truly a better strategy, but I’m not patient enough (nor do I care enough) to try to evaluate any other strategy.
In the rest of the function, I save the initial hand and the hand after passing cards. I found the mean card value for each player’s hand, both pre and post card passing. I also found the variance of players’ hand values for pre and post card passing. The final statistic I saved was the variance difference after passing the cards. Here, I subtracted the after pass hand variance from the before pass hand variance. My idea was that if the variance shrinks after passing cards, then the higher this value goes, the more the variance has shrunk.
canadianSalad <- function(numPlayers=4,numPass=3){
  # Create deck with 4 suits of 13 cards
  # Because an Ace is the worst in Canadian Salad, it's represented by 14 instead of 1
  deck <- rep(c(2:14), 4)

  handNumCards <- length(deck) %/% numPlayers # How many cards each player gets
  kitty <- length(deck) %% numPlayers # Number of cards in leftover pile

  if(kitty != 0){
    deck <- tail(sample(deck), -kitty) # Remove kitty from bottom of deck
  }

  hands <- split(sample(deck), 1:numPlayers) # Deal cards

  # Pass high cards
  highCards <- lapply(lapply(hands, sort), tail, numPass) # Get the high cards to pass
  handsMinusHighCards <- lapply(lapply(hands, sort), head, -numPass) # Remove high cards from hand
  passHighCards <- c(highCards[-1], highCards[1]) # Shift first hand to last hand and move all other hands up
  newHands <- Map(c, handsMinusHighCards, passHighCards) # Combine hands w/o high cards and shifted hands of high cards

  # Statistics
  beforePassMeans <- unlist(lapply(hands, mean)) # Find mean card value of each hand before pass
  afterPassMeans <- unlist(lapply(newHands, mean)) # Find mean card value of each hand after pass
  beforePassVar <- var(beforePassMeans) # Find variance of mean hand value before pass
  afterPassVar <- var(afterPassMeans) # Find variance of mean hand value after pass
  varDiff <- beforePassVar - afterPassVar # Subtract after pass variance from before pass variance

  return(list(beforePassMeans, afterPassMeans, beforePassVar, afterPassVar, varDiff)) # Return list of these stats
}
I next created a function so I could simulate this beginning part of Canadian Salad however many times I wanted to. This function also takes number of players and number of cards to pass (so that they can be passed to previous function) as well as the number of hands, both pre and post card passing, to simulate. With the results of running the previous function 10000 times, I created data frames for each subtype of variable (variances, means, and variance differences). Because I plan to also see how the different number of players and number of cards passed affects the results, I included columns in the data frame which would record the input variables.
simCanadianSalad <- function(numPlayers, numPass=3, reps=10000){
  results <- replicate(reps, canadianSalad(numPlayers, numPass)) # Simulate Canadian Salad reps times

  # Create data frames for each statistic
  varsDF <- data.frame("Variance" = unlist(c(results[3,], results[4,])),
                       "Hand" = factor(c(rep("Before Pass", reps), rep("After Pass", reps)), levels = c("Before Pass", "After Pass")),
                       "Players" = paste(numPlayers, "Players"),
                       "NumPassed" = paste(numPass, "Cards Passed")
                       )
  meansDF <-data.frame("Mean" = unlist(c(results[1,], results[2,])),
                       "Hand" = factor(c(rep("Before Pass", reps*numPlayers), rep("After Pass", reps*numPlayers)), levels = c("Before Pass", "After Pass")),
                       "Players" = paste(numPlayers, "Players"),
                       "NumPassed" = paste(numPass, "Cards Passed")
                       )
  diffDF <- data.frame("Diff" = unlist(results[5,]),
                       "Players" = paste(numPlayers, "Players"),
                       "NumPassed" = paste(numPass, "Cards Passed")
                       )
  return(list(varsDF, meansDF, diffDF))
}
Finally, I created a list of the different numbers of players I wanted to look at, as well as the different numbers of cards passed I wanted to check. I crossed these two lists against each other so I could see how the variables related to one another. Then I finally simulated all the different hands for each pair of variables and merged the respective statistic data frames together.
numPlayers<- c(4,5,6)
numPass<- c(2,3,4,5)

# Permute Number of Players and Number of cards to pass
allParamsPermutations <- crossing(numPlayers, numPass) # Create tibble of permutations
allParamsPermutations <- split(allParamsPermutations, seq.int(nrow(allParamsPermutations))) # Separate tibble into list of tibbles for each row

# Simulate Canadian Salad for each permutation of variables
allCombos <- lapply(allParamsPermutations, function(x) do.call(simCanadianSalad, x))

# Merge the statistic data frames from each variable permutation into one data frame for each statistic
allCombosMerged <- purrr::pmap(allCombos, dplyr::bind_rows)
Results
Okay, now that I have all my simulated data, it’s time to get to
plotting. I love using the ggridges package when looking at
distributions. I think the theme_ridges function gives a clean,
minimal background to plot against. It’s also a great package for
overlapping distributions as it’s quite easy to alter the transparency
of the plots. The first plot I want to check is the variance of the
hands both pre and post card passing.
ggplot(allCombosMerged[[1]], aes(x=Variance, y=Players, fill=Hand, color=Hand)) +
  ggridges::geom_density_ridges(alpha=0.5, scale=0.9) +
  scale_y_discrete(expand = c(0,0)) +
  scale_x_continuous(expand = c(0,0)) +
  scale_fill_manual(values = c("#D55E0050", "#0072B250"), labels = c("Before Pass", "After Pass")) +
  scale_color_manual(values = c("#D55E00", "#0072B2"), guide = "none") +
  coord_cartesian(clip = "off")+
  guides(fill = guide_legend(
    override.aes = list(
      fill = c("#D55E00A0", "#0072B2A0"),
      color = NA
    )
  )) +
  ggridges::theme_ridges(center = TRUE) +
  xlim(NA, 6.75) +
  labs(x="Hand Score Variance (per round)", y=NULL)
## Warning: Removed 42 rows containing non-finite values (stat_density_ridges).
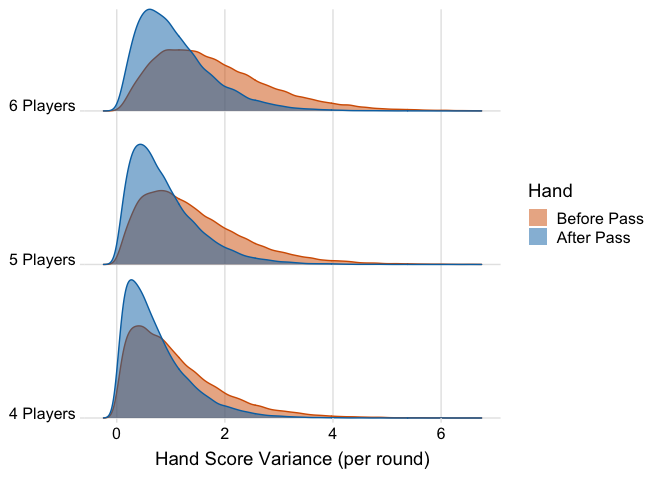
The first thing that sticks out is that there is more variance as more players are added to the game. That makes sense as each player gets less cards as the number of players increase. Seems fairly intuitive. It also looks like passing cards has more impact on hands will low amount of cards. Everything seems good so far. Let’s take a look at the average hand card value for each player.
ggplot(allCombosMerged[[2]], aes(x=Mean, y=Players, fill=Hand, color=Hand)) +
  ggridges::geom_density_ridges(alpha=0.7, scale=0.9) +
  scale_y_discrete(expand = c(0,0)) +
  scale_x_continuous(expand = c(0,0)) +
  scale_fill_manual(values = c("#D55E0050", "#0072B250"), labels = c("Before Pass", "After Pass")) +
  scale_color_manual(values = c("#D55E00", "#0072B2"), guide = "none") +
  coord_cartesian(clip = "off")+
  guides(fill = guide_legend(
    override.aes = list(
      fill = c("#D55E00A0", "#0072B2A0"),
      color = NA
    )
  )) +
  ggridges::theme_ridges(center = TRUE) +
  labs(x="Hand Score Mean (per round)", y=NULL)
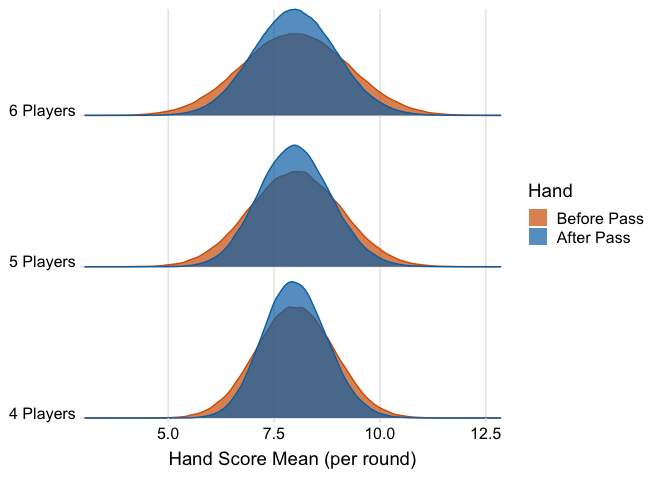
We see the median/mean value stay about the same after passing cards; however, it’s quite evident that passing cards narrows the distribution. This would also confirm the idea that hands become more equal after passing cards. Finally, lets take a look at the difference in variance after passing cards.
ggplot(allCombosMerged[[3]], aes(x=Diff, y=Players, fill=NumPassed, color=NumPassed)) +
  ggridges::geom_density_ridges(alpha=0.7, scale=0.9, quantile_lines = TRUE, quantiles = c(0.5,0.975)) +
  scale_y_discrete(expand = c(0,0)) +
  scale_x_continuous(expand = c(0,0)) +
  scale_fill_brewer(palette = "RdBu") +
  scale_color_brewer(palette = "RdBu") +
  ggridges::theme_ridges() +
  labs(x = "Before Pass Variance - After Pass Variance", y=NULL) +
  xlim(NA, 4)
## Warning: Removed 108 rows containing non-finite values (stat_density_ridges).
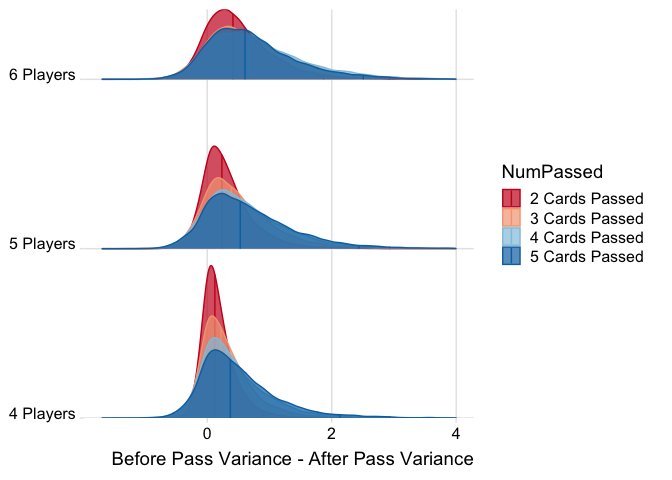
For this plot, I wanted to see how the number of cards passed interacted with the number of players. My initial observation is that passing cards has a much bigger impact as the number of players increase and the number of cards per hand decreases. The distributions are both wider and more right skewed as the number of players increases.
The other thing I notice is that increasing the number of cards passed increasingly minimizes the variance of the hands, to a point. With only 4 players, it’s very easy to see the 4 different distributions from the differing numbers of cards passed. When there are 6 players, however, there is much more overlap between the distributions. In fact, it’s almost impossible to see the distributions for when 3 and 4 cards are passed. My intuition here is that each card passed will decreasingly minimize variance until you pass half the cards in each hand, at which point the trend will reverse. In a game of 6 players, each player only has 8 cards. Thus, I would guess that passing 4 cards would create the most equal hands, while passing 3 or 5 cards would be slightly less effective. I don’t have any statistical proofs to back this up, but the visualizations seem to be portraying this idea.
Fin
I had a good time doing this. I learned I should probably trust the Applied Math PhD’s student’s mathematical intuition a little more than my own, at least at this point. I also realized that medical school takes up a much larger portion of my time than I had thought. It’s taken quite a few different sessions to put this all together. It was a nice break from the biology I’ve been pounding in my head the past few months. I will just have to make more time for camping, math, and Canadian Salad.